OpenJDK Startup - Late 2019 Edition
With a couple of weeks left until development work on OpenJDK 14 starts to ramp down, I figured it’s time to take a fresh look at what’s been going on in the OpenJDK to make java and friends start up faster, use less memory et.c.
Hello World(s)
I’ve previously blogged about improvements to Hello World from java 8 through 11, java 8 through 12, so I guess it’s only fair to start off with a refreshed look at where we’re at. I’ll leave out JDK 10 and 12, since they have been superseded by 11 (LTS) and 13, respectively. I’ll keep JDK 9 around, since although it’s also been superseded it’s the last major release under the old release model.
Without any tuning or preparation of the JDKs, this is the startup numbers I get today for the Hello World, Hello Lambda and Hello Concat samples on my machine:
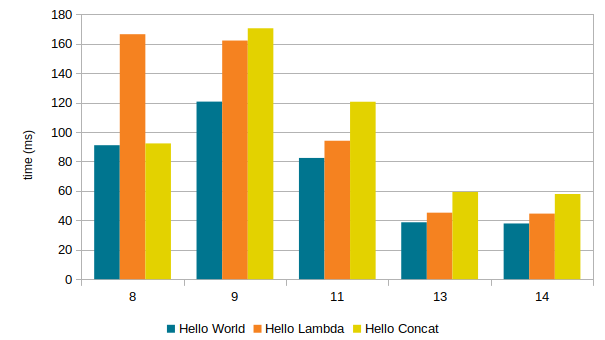
(8 is 8u231, 9 is 9.0.4, 11 is 11.0.5, 13 is 13.0.1, 14 is the latest build off of jdk/jdk as of today)
Overall we’re down dramatically compared to the historic high for each “app”: more than twice as fast on Hello World, almost four times faster for Hello Lambda..
JDK 14 is on target to be a small improvement over JDK 13 on these minimal startup tests, even though the relative improvement is tiny in comparison. While we have done a number of cleanups and improvements, there’s no denying that the incremental improvement here is small in both relative and absolute terms. But that’s OK, since JDK 13 is really good.
If the numbers skew a bit from my earlier posts it’s because I’ve not primed the JDKs with a CDS archive by running java -Xshare:dump in this experiment. This was a trick few knew or cared about, and which we since JDK 12 no longer have to care about thanks to Default CDS Archives being a thing. If you’re really chasing milliseconds there are ways to tune and improve, but our focus is to improve the default - out-of-the-box - experience, so that’s what I choose to show here.
Scaling up
Now, just because Hello World runs in 37.9ms or whatever, that doesn’t mean java will start up and run any application just as fast. Simplifying those early bootstrap overheads is great, but risk disappearing into the background noise when loading that big app server or even that new and shiny microservice framework thing.
As an arbitrary object of a few experiments, I downloaded the Micronaut Hello World example, modified it slightly to not turn off verification and disable most JIT compilation (no cheats!) and add a shutdown hook.
Run that in a loop a few times, take the average:
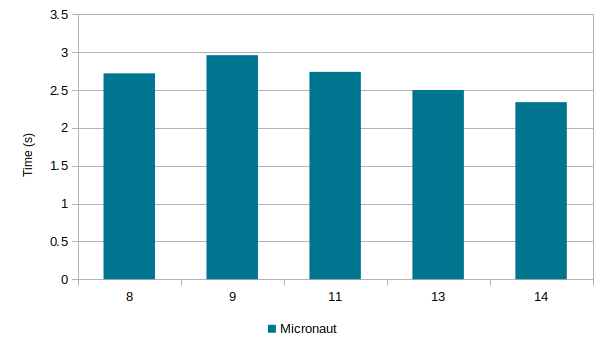
We went from somewhere around 2.72s on JDK 8u231, up to 2.96s on JDK 9.0.4, then dropping down through recent feature releases, currently clocking in at 2.35s on the freshest build of JDK 14. Nothing dramatic, but a 14-15% reduction on the aggregate since JDK 8, and also an improvement relative JDK 13. Perhaps more surprising is that total memory used by the JVM has been dropping, too:
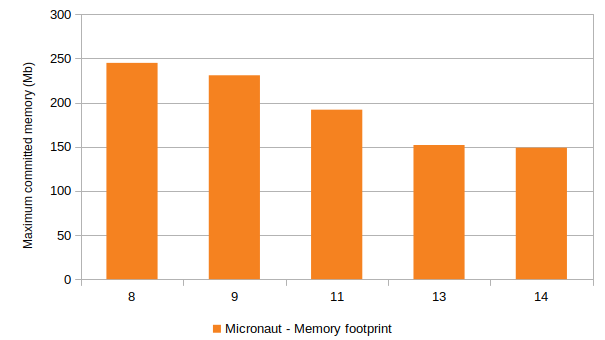
Yes: 40% less memory used since JDK 8! Looking at various hardware counters we see similar improvements: we’re down 40% total CPU used compared to JDK 9 etc.
We can of course tune this down even further. Just applying AppCDS and I got it down to about 1.65s using 120Mb. There are other ways of tuning this down further, inside or outside the scope of the OpenJDK.
But the point I want to underscore here is that you’re likely to get substantial startup and footprint improvements just by upgrading to 13 (and 14, in due time) without any tuning at all!
There are more things happening here than the bootstrap improvements I’ve blogged about before. Let’s break it down…
Class loading improvements
One obvious cause for larger applications taking seconds to start are the overheads related to class loading, linking and bytecode verification. When loading and linking classes the runtime might also spend time generating bytecode behind the scenes.
By storing the resulting data in ways the JVM can easily deal with, AppCDS or Dynamic CDS can often reduce startup time by 20-50%. Not everyone will end up deploying App- or Dynamic CDS, and even if they did the sweet spot might not be to include everything your app might ever use.
So while there’s good work being done to make CDS even better, there’s also a good case to optimize class loading etc in the absense of CDS. And there’s been plenty of improvements:
- On micronaut, default method generation at link time could take around 800-850M instructions in JDK 8 and 9, well over 0.3s on my machine. Two different improvements in 13 (JDK-8219713) and 14 (JDK-8233497) brought this down to ~250M instructions, or about 0.1s
- Bytecode verification speedups due improvements such as JDK-8219579
- Many small improvements to reduce work, such as removing implicit conversion between
Method*s andMethodHandles (JDK-8233913).
Compiler improvements
The other main contributor to the startup time of a JVM-based application are the direct and indirect effects of just-in-time - JIT - compilation. When just starting up, the JVM interpret bytecode, while spinning up JIT compiler threads in the background with the sole goal of optimizing the bytecode your application seem to be spending most time in.
By default, the OpenJDK JVM, HotSpot, has a tiered configuration where bytecode is first compiled by a fast compiler, C1, into a form that is faster than interpreting bytecode, but also has a lot of profiling counters that help the next tier JIT compiler to optimize as aggressively as possible. By default the next JIT compiler used is C2, which is slower than C1 but generates code that is often many times faster.
Generally: the faster all these compilations happen, the less time is spent executing code in less optimized phases such as the interpreter and C1-compiled code with profiling. But the more time you allow code to stay in a profiling mode, the better the final result. So there are a few trade-offs.
Now: one reason we’re spending less resources early is because we don’t spin up JIT threads as aggressively as we did before. This is due the introduction in JDK 11 of -XX:+UseDynamicNumberOfCompilerThreads (JDK-8198756). This means we’ll only start up more C1 and C2 threads if compilation requests start to queue up faster than the current set can handle them, which means we run a smaller number of threads during startup, which means the JVM is less hungry for memory and CPU.
This is amplified by a number of optimizations in the C1 and C2 compilers themselves which reduce the work required for each compilation. This ranges from improvements to use optimized hardware instructions (when possible), to reducing allocations. The real effect of all this varies between platforms, but I’ve seen significant speed-ups on every system we test on, which combined with the now more dynamic nature of how many compilation threads we use definitely translate to overall less resource consumption.
What’s next?
Who knows… :-)
I’ll continue paying close attention to how well OpenJDK performs during startup/warmup, regardless of whether it’s for highly tuned and specialized use cases, or just to run those builds and tests a bit faster.
More
I did a talk on some of this and some related stuff at JavaZone. Slides here.
Edits
Added Y-axis to first graph, h/t @NebulaBytes