Zip lookups - a word from the sponsor
This has been a fun few weeks, much thanks to this guy:
One positive outcome of social distancing is that I'm now an @OpenJDK contributor! This patch saves 35% time on lookup of non-existing ZIP file entries: https://github.com/openjdk/jdk/commit/fc728278c2bc4af041f2ffa1fba54bcdc4c0e4e3 Thanks to @cl4es for awesome help and sponsoring!</p>— Eirik Bjørsnøs (@eirbjo)
TL;DR: we didn’t settle for 35%.
Looking up entries in jars can be a substantial part of what a big java application does during startup. In the Spring PetClinic sample application perhaps 10% of the startup time is spent looking up entries – mostly class files.
And what happens when your application is made up of a lot of jar files on a class path? Most of those lookups will be misses. With hundreds of jar files, we might have hundreds of missed lookups per hit.
So it makes sense to care about the cost of missed lookups.
In this post I’ll look at some recent - and some not-so recent - improvements in this area.
Background
Jar files are everywhere. And those jar files are essentially a type of zip file. So when loading classes or resources, we are looking up and reading entries from zip files.
Historically, much of the zip file logic was implemented in native C. Partially aided by the move to boot the JDK itself from runtime images rather than the rt.jar, the native zip implementation was ported to Java in JDK 9.
Improved stability was a major driver behind this effort, but also improved performance.
C is fast - but JNI can be slow
Java faster than C?! Well, yes and no.
I recently wrote a microbenchmark to investigate the performance of ZipFile lookups. Let me briefly skip ahead and use it to illustrate some of the differences between the JDK 8 and 9.
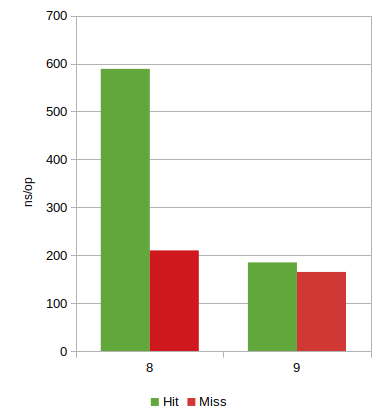
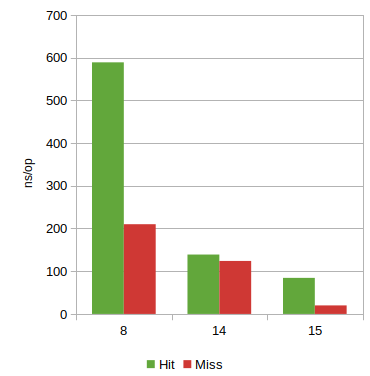
The microbenchmark measures the time of looking up an entry in a zip (or jar) file, and it seems porting from a native library to a Java implementation came with a significant boost: almost 3x on lookup hits!
So while the native code itself is likely very fast - the overheads of hopping back and forth between Java and native via JNI appears to be significant. When you have to do it over and over the costs add up quick. This was prominently evident in the case of a hit, while each miss was a single JNI call. Still a win, though.
Setting the stage
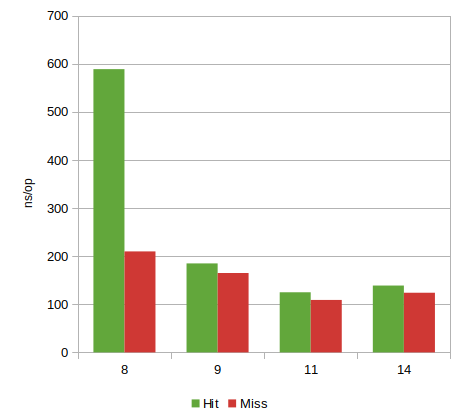
There’s been some additional improvements over time, especially leading up to JDK 11.
Hits almost 5x faster than in 8 - misses almost twice as fast. There also appears to have been a 10% regression
from 11 through 14. A bit unclear why, as there’s been few changes to ZipFile itself.
The recent past
A couple of weeks ago Eirik Bjørsnøs shows up on the OpenJDK lists. First out with an improvement to make looking up entries in multi-release jar files faster.
Bloom filters?
Before I’ve even had a change to push his first patch, along comes a patch using bloom filters to avoid spending time looking up entries that aren’t there. Along with data showing a decent impovement on the aforementioned PetClinic. Was it still Monday..?
While I enjoy a good bloom filter as much as anyone, they might add some footprint overhead and the additional test would be an extra cost if we know the lookup will be a ‘hit’. Since there are some widely deployed ways of avoiding misses, e.g., using uber JARs, it’s prudent to not sacrifice hit performance to gain an improvement on misses.
Slash and fold
I suggested we first try and see how far we can get with optimizations that try to be neutral with regards to footprint and lookup hit performance.
This bore fruit within days by avoiding a redundant arraycopy. After that we improved on that with an optimization to fold back-to-back lookups of “name” and “name/”.
Leading up to this was a flurry of patches from Eirik, which I dutifully merged, cleaned up, tested, and sometimes improved upon.
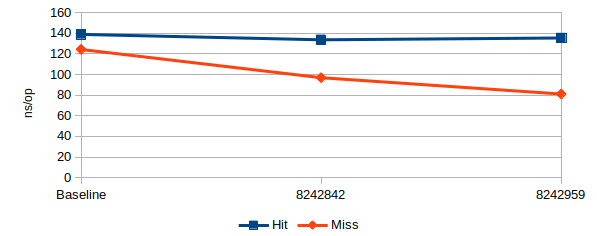
That’s the 35% reduction in lookup speed right there - or a 1.5x speed-up, if you like.
Going for allocation-free misses
I’m just now wrapping up the next step in this optimization saga. While I authored most of this patch, Eirik has made many suggestions and experiments to back it up and check alternatives.
We realized early on that we could probably do something similar to avoid eagerly allocating the encoded
byte[]. We explored a few variants, but settled for the patch that is now
out for review:
- Calculate hash values consistent with
String.hashCode - Add a virtual
'/'in all places so that we can keep doing a single lookup for"name"and"name/" - Only on a perfect hash match do we decode the value stored in the zip file to do a comparison
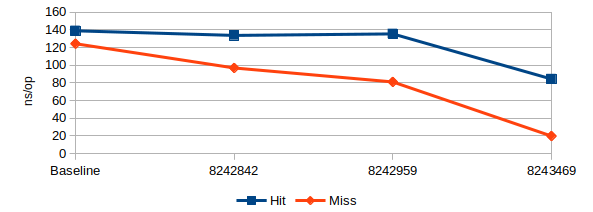
In this microbenchmark both time per hit and time per miss now drops - and substantially so. Misses see a 6x speedup!
This is a slight exaggeration: Since lookups now use String.hashCode and
Strings caches their own hash value, the microbenchmark will not show the
cost of calculating the hash.
I added variants that always create a new String so that the hash
value is never cached, and the relative difference - excluding the cost to
create that String is around 25ns/op in this test. If we assumed we always
had to calculate the hash, that would put misses at ~45ns/op and hits around 109ns/op - still a
great improvement on both!
But since we’re likely looking up an entry in more than one place - sometimes many times - it’s still reasonable to think that we in a typical case will be pretty close to the numbers we see here, on average.
Digression: Instrumenting the gain
I couldn’t see the same speed-up as Eirik was reporting when I tried his approach, which was to add a few PerfCounters to measure the time spent during lookup hits and misses. It turns out this adds ~1.1us/op to both hits and misses on my system, but seem to have less overhead on his system. So when he saw ~35% improvements on PetClinic, I saw something like a ~15% improvement.
Another issue we both ran into when instrumenting something like PetClinic with PerfCounters like these is that some of the optimizations we did to misses made it look like cost of hits were regressing. These “regressions” were nowhere to be found in the microbenchmark that I created for JDK-8243469.
The explanation is that when optimizing things away from the “miss” path that were previously shared with the “hit” path, then a hit is now much more likely to call into take paths which haven’t been warmed up as much. So the hits look costlier because they spend more time in the interpreter compared to before, even though they do roughly the same amount - or a bit less - of work.
Conclusion
By moving the Zip implementation to Java in JDK 9 we started a series of
optimizations that have continued, and zooming in on the speed of getEntry
we’re now looking at a 7x speedup on hits and 12x speedup on misses in JDK 15
compared to JDK 8.
On the Spring PetClinic application, these improvements have improved startup time by a few hundred milliseconds. Hopefully someone will appreciate that. :-)
Big thanks to @eirbjo for a great collaboration! And to Lance Andersen, Volker Simonis and others who helped review the patches.
(Hmm, now maybe this RFE that I filed years ago will be worth fixing…)